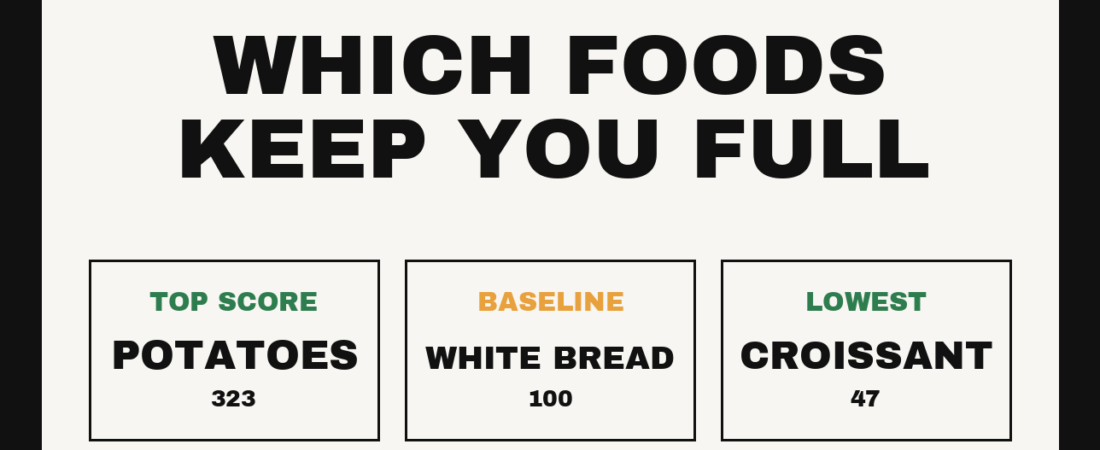
Short answer: in 1995 Holt and colleagues fed people 38 different foods in matched 240 kcal portions and tracked hunger for two hours afterwards. Boiled potatoes scored 323 against white bread’s 100. Croissants scored 47. Serving weight, protein, fibre and water content predicted fullness; fat content and how much people liked the food predicted the opposite. It is still the only study of its kind, built on 11 to 13 people per food, so treat the table below as a map rather than a measurement.
Work out the calorie density of anything you eat with the calorie density calculator, or set a per-meal protein target with the protein per meal calculator.
What the study actually did
Thirty-eight foods were split into six groups: fruit, bakery products, snack foods, carbohydrate-rich foods, protein-rich foods and breakfast cereals. Every portion was matched for energy at 1000 kJ, which is 240 kcal, so nothing in the comparison is about calorie content.
Participants rated their fullness every 15 minutes for two hours, then were allowed to eat freely. Each food’s score is the area under its two-hour satiety curve, expressed as a percentage of white bread’s. White bread was set at 100 because it sat near the middle, not because it is a target.
The check that matters: how much people ate at the end was negatively correlated with the satiety score. Foods that kept people full on paper also reduced what they ate next.
The full rankings
| Food | Satiety index | Group |
|---|---|---|
| Boiled potatoes | 323 | Carbohydrate |
| Ling fish | 225 | Protein |
| Porridge (oatmeal) | 209 | Cereal |
| Oranges | 202 | Fruit |
| Apples | 197 | Fruit |
| Wholemeal pasta | 188 | Carbohydrate |
| Beef | 176 | Protein |
| Baked beans | 168 | Protein |
| Grapes | 162 | Fruit |
| Wholemeal bread | 157 | Bakery |
| Grain bread | 154 | Bakery |
| Popcorn | 154 | Snack |
| All-Bran | 151 | Cereal |
| Eggs | 150 | Protein |
| Cheese | 146 | Protein |
| White rice | 138 | Carbohydrate |
| Lentils | 133 | Protein |
| Brown rice | 132 | Carbohydrate |
| Honeysmacks | 132 | Cereal |
| Crackers | 127 | Snack |
| Cookies | 120 | Bakery |
| White pasta | 119 | Carbohydrate |
| Bananas | 118 | Fruit |
| Jellybeans | 118 | Snack |
| Cornflakes | 118 | Cereal |
| Special K | 116 | Cereal |
| French fries | 116 | Carbohydrate |
| Sustain | 112 | Cereal |
| White bread | 100 | Bakery |
| Muesli | 100 | Cereal |
| Ice cream | 96 | Snack |
| Crisps | 91 | Snack |
| Yogurt | 88 | Snack |
| Peanuts | 84 | Snack |
| Mars bar | 70 | Snack |
| Doughnuts | 68 | Bakery |
| Cake | 65 | Bakery |
| Croissant | 47 | Bakery |
Honeysmacks, Sustain, Special K and All-Bran were Australian breakfast cereals as sold in the early 1990s. Their formulations have changed since, which is one reason the table is better read as a pattern than as a shopping list.
What predicted fullness
| Property | Effect on satiety |
|---|---|
| Serving weight | Raised it |
| Protein content | Raised it |
| Fibre content | Raised it |
| Water content | Raised it |
| Fat content | Lowered it |
| Palatability rating | Lowered it |
Three of the four risers — weight, water, fibre — are the same thing viewed from different angles. They are all ways of occupying stomach volume without supplying energy, which is exactly the mechanism Barbara Rolls spent a career demonstrating. Protein is the one that works differently, through hormonal and metabolic signalling rather than bulk.
The two that lowered satiety are the uncomfortable half. Fat is the densest macronutrient, so a fixed 240 kcal of a fatty food is physically small. And palatability lowering fullness means part of what the index measures is simply how much people want to keep eating a food, which is not the same thing as a physiological hunger signal.
Where the evidence is thin
This is one study from 1995 with 11 to 13 people eating each food. It has never been replicated at the same scale. Individual scores carry far more uncertainty than three-digit precision suggests, and the gap between, say, 154 and 150 is noise.
The matched-energy design is also not how anyone eats. A 240 kcal portion of boiled potato is roughly 275 g; 240 kcal of croissant is roughly 60 g. The index is telling you something real about energy density, but it is doing it by serving people portions they would never choose.
Two hours is also a short window. Acute fullness ratings are much easier to shift than real intake. In a systematic review of 107 fibre treatments across 44 publications, Clark and Slavin found only 39% significantly reduced appetite ratings and only 22% reduced food intake — the signal weakens sharply as you move from what people report to what they actually eat.
Where the mechanism does hold up over months is protein. Weigle and colleagues raised protein from 15% to 30% of energy in 19 adults and let them eat freely for 12 weeks. Intake fell by 441 ± 63 kcal a day and weight fell by 4.9 ± 0.5 kg, without anyone being asked to restrict anything.
How to actually use it
The ranking is the least useful part. The pattern is the finding: for a fixed number of calories, prefer foods that arrive heavy, wet, high in protein or high in fibre. That is a rule you can apply to a food that was never in the study, which no table can do.
It also explains why hitting a daily protein target makes a deficit easier to hold than willpower does, and why fibre intake is worth tracking even though it supplies almost no usable energy.
FAQ
What is the most filling food?
Of the 38 foods tested, boiled potatoes, at 323. Nothing else came close — second place was ling fish at 225. Potatoes are mostly water, so 240 kcal of them is a large, heavy plateful, and they are not especially palatable plain.
Why do croissants score so low?
They score 47, the lowest of the 38. They are high in fat, so 240 kcal is about 60 g of food, and they rated highly for palatability. Both of those pushed the score down independently.
Is the satiety index still accurate?
The direction of the findings has held up well and matches later work on energy density and protein. The specific numbers have not been independently reproduced, and several of the branded cereals no longer exist in the tested form. Use the ordering, not the digits.
Is protein or fibre better for keeping you full?
Both raised satiety in the index, but protein has the stronger record in longer trials of actual intake. Fibre’s acute effect is real but inconsistent across fibre types. If you can only prioritise one for appetite, protein is the better bet; the ideal is both.
Does this mean I should stop eating croissants?
No. It means a croissant is a poor choice if your goal for those 240 calories is to stop being hungry. If your goal is to enjoy a croissant, the index has nothing to say about it.
Sources
- Holt SH, Miller JC, Petocz P, Farmakalidis E. A satiety index of common foods. European Journal of Clinical Nutrition, 1995;49(9):675–690.
- Weigle DS, Breen PA, Matthys CC, Callahan HS, Meeuws KE, Burden VR, Purnell JQ. A high-protein diet induces sustained reductions in appetite, ad libitum caloric intake, and body weight despite compensatory changes in diurnal plasma leptin and ghrelin concentrations. American Journal of Clinical Nutrition, 2005;82(1):41–48.
- Clark MJ, Slavin JL. The effect of fiber on satiety and food intake: a systematic review. Journal of the American College of Nutrition, 2013;32(3):200–211.
General information, not medical advice.
Part of The Research — studies and position stands explained plainly.
GramGoal Team. We build nutrition calculators and price-check the supplement market monthly. General information, not medical advice. See our methodology and affiliate disclosure.