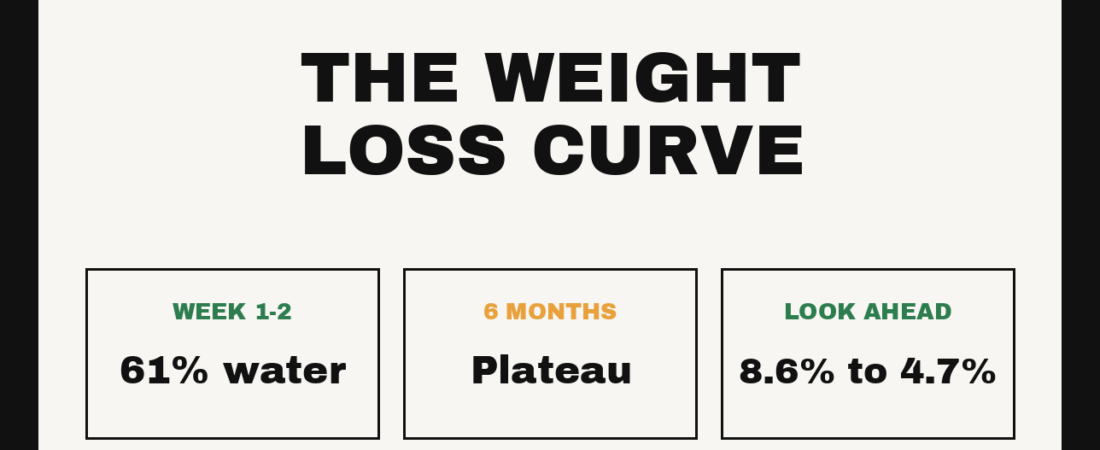
Short answer: weight loss is not a straight line, and it is not supposed to be. The first week or two is inflated by glycogen and the water bound to it, the rate then slows month after month, and in controlled trials the average plateau arrives at about six months. In the Look AHEAD trial, the intensive lifestyle group lost 8.6% of body weight by one year and was still holding 4.7% at both four and eight years. The curve bending is normal physiology plus drifting intake — not proof that your metabolism has broken.
Project your own curve with the weight loss timeline calculator, or set the deficit first with the calorie deficit calculator.
Weeks one and two are mostly water
Glycogen is stored wet. Each gram of it is held with roughly three grams of water and some potassium, so when you cut calories — and especially when you cut carbohydrate — the first thing that leaves is the stored carbohydrate and its water. Kreitzman and colleagues made this point directly in 1992: early changes in total body potassium on very-low-calorie diets largely track glycogen, not tissue.
Yang and Van Itallie quantified it in 1976. Six men lived on a metabolic ward through three ten-day regimens, with the composition of what they lost calculated from energy and nitrogen balance.
| 10-day regimen | Weight lost | Water | Fat | Fat lost |
|---|---|---|---|---|
| Starvation | 751 g/day | 60.9% | 32.4% | 243 g/day |
| 800 kcal, mixed | 278 g/day | 37.1% | 59.5% | 167 g/day |
| 800 kcal, ketogenic | 467 g/day | 61.2% | 35.0% | 163 g/day |
Read the last two rows together, because they are the whole lesson. Both diets supplied 800 kcal. The low-carbohydrate version shed about 68% more total weight over ten days — and lost very slightly less fat per day. All of the extra was water. The scale rewarded the carbohydrate cut; the body composition did not.
One caveat the study itself imposes: these are ten-day averages in six severely obese men. The paper does not break the loss down day by day, so nobody can honestly tell you what percentage of day three was water.
Why the curve bends
A smaller body costs less to run. Every kilogram you lose shaves a little off resting expenditure and a little off the cost of moving around, so a deficit that was 500 kcal in January is a smaller deficit by April even if your eating has not changed at all. Loss therefore decays towards a new steady weight rather than continuing in a line.
Hall and colleagues put numbers on this in the Lancet in 2011. Their rule of thumb: a permanent change of about 10 kcal per day produces an eventual change of about one pound of body weight. The important half of that sentence is eventual — they estimate it takes roughly one year to reach half of the final change and about three years to reach 95% of it.
That is a different world from the 3,500-calorie rule, which assumes the deficit never shrinks. Applied to a roughly 480 kcal/day cut, the static rule predicts about 22 kg lost in year one — which Hall’s group put at about 100% more than their dynamic model predicts.
The six-month plateau
Franz and colleagues pooled weight-loss trials that followed people for at least a year. Across methods, maximum loss landed at about six months and then flattened.
| Intervention | 6 months | 12 months | 24 months | 48 months |
|---|---|---|---|---|
| Diet alone | 4.9 kg | 4.6 kg | 4.4 kg | 3.0 kg |
| Diet plus exercise | 7.9 kg | 7.6 kg | — | 3.9 kg |
Two things stand out. The regain is real — roughly 39% of peak loss for diet alone and about half for diet plus exercise by four years. And no group returned to baseline. Partial regain is the norm; total failure is not.
Look AHEAD, which followed 5,145 adults with type 2 diabetes, shows the same shape over a longer run: 8.6% at year one, 4.7% at year four, 4.7% at year eight. Of the participants who hit 10% loss in year one, 39% were still at 10% eight years later.
Is it metabolism or is it intake?
Both, in wildly uneven proportions. Hall and Kahan’s 2018 accounting is the clearest summary: for each kilogram lost, expenditure falls by about 20–30 kcal/day, while appetite rises by about 100 kcal/day. By the time someone plateaus, expenditure has dropped by under 200 kcal/day — but energy intake has crept up by 600–700.
So the plateau is mostly the eating side, and it is mostly not deliberate. Thomas and colleagues modelled this in 2014 and found that adding random days of non-adherence reproduced the observed six-month plateau, while inflating metabolic adaptation by 5–10% moved the plateau’s depth but not its timing. Under perfect compliance, their simulated weight simply kept falling. That is a modelling result with adherence values fitted to trial data, not a direct measurement — worth holding loosely.
Metabolic adaptation is nonetheless real and can be large at the extremes. In the Biggest Loser cohort, resting metabolic rate ran 244 kcal/day below prediction at week six and 504 kcal/day below it by week 30 — after 30 weeks of punishing restriction and training. Most dieters are nowhere near that.
Where the evidence is thin
Trial averages hide enormous individual spread; the mean curve is not your curve. Most composition work on early loss comes from small metabolic-ward studies in severely obese men decades ago. The adherence-versus-adaptation split rests partly on models rather than direct measurement. And almost every long-term figure above comes from supervised programmes with regular contact, which is not the condition most people lose weight in.
FAQ
What is the normal progression of weight loss?
Fast for one to two weeks, largely from glycogen and water. Steadier through months two to five. Flattening around month six at roughly 5–10% of starting weight in supervised trials, then partial regain unless effort is sustained.
What does a weight loss timeline look like in the first 3 months?
The steepest part of the whole curve. Expect the first fortnight to overstate fat loss and months two and three to look disappointing by comparison even though fat loss is more consistent then. Three months is usually too early for a true plateau.
Why did my weight loss stop after 6 months?
Because your deficit shrank from both ends. A lighter body burns less, and measured intake tends to drift up by several hundred calories a day without the person noticing. The expenditure drop is typically the smaller of the two.
Is it normal to lose 5 kg in the first week?
On an aggressive or low-carbohydrate start, it happens, and most of it is water. It will not repeat in week three, and the apparent slowdown is not a failure — it is the water running out.
Does the scale going up mean I gained fat?
Over a day or a week, almost never. See daily weight fluctuations for what sodium, carbohydrate and gut contents do to the number.
Sources
- Hall KD, Sacks G, Chandramohan D, Chow CC, Wang YC, Gortmaker SL, Swinburn BA. Quantification of the effect of energy imbalance on bodyweight. Lancet, 2011;378(9793):826–837.
- Franz MJ, VanWormer JJ, Crain AL, Boucher JL, Histon T, Caplan W, Bowman JD, Pronk NP. Weight-loss outcomes: a systematic review and meta-analysis of weight-loss clinical trials with a minimum 1-year follow-up. Journal of the American Dietetic Association, 2007;107(10):1755–1767.
- Yang MU, Van Itallie TB. Composition of weight lost during short-term weight reduction. Journal of Clinical Investigation, 1976;58(3):722–730.
- Kreitzman SN, Coxon AY, Szaz KF. Glycogen storage: illusions of easy weight loss, excessive weight regain, and distortions in estimates of body composition. American Journal of Clinical Nutrition, 1992;56(1 Suppl):292S–293S.
- Pi-Sunyer X, Blackburn G, Brancati FL, et al. (Look AHEAD Research Group). Reduction in weight and cardiovascular disease risk factors in individuals with type 2 diabetes: one-year results of the Look AHEAD trial. Diabetes Care, 2007;30(6):1374–1383.
- Look AHEAD Research Group. Eight-year weight losses with an intensive lifestyle intervention: the Look AHEAD study. Obesity, 2014;22(1):5–13.
- Hall KD, Kahan S. Maintenance of lost weight and long-term management of obesity. Medical Clinics of North America, 2018;102(1):183–197.
- Thomas DM, Martin CK, Redman LM, Heymsfield SB, Lettieri S, Levine JA, Bouchard C, Schoeller DA. Effect of dietary adherence on the body weight plateau: a mathematical model incorporating intermittent compliance with energy intake prescription. American Journal of Clinical Nutrition, 2014;100(3):787–795.
- Johannsen DL, Knuth ND, Huizenga R, Rood JC, Ravussin E, Hall KD. Metabolic slowing with massive weight loss despite preservation of fat-free mass. Journal of Clinical Endocrinology and Metabolism, 2012;97(7):2489–2496.
General information, not medical advice.
Part of The Research — studies and position stands explained plainly.
GramGoal Team. We build nutrition calculators and price-check the supplement market monthly. General information, not medical advice. See our methodology and affiliate disclosure.