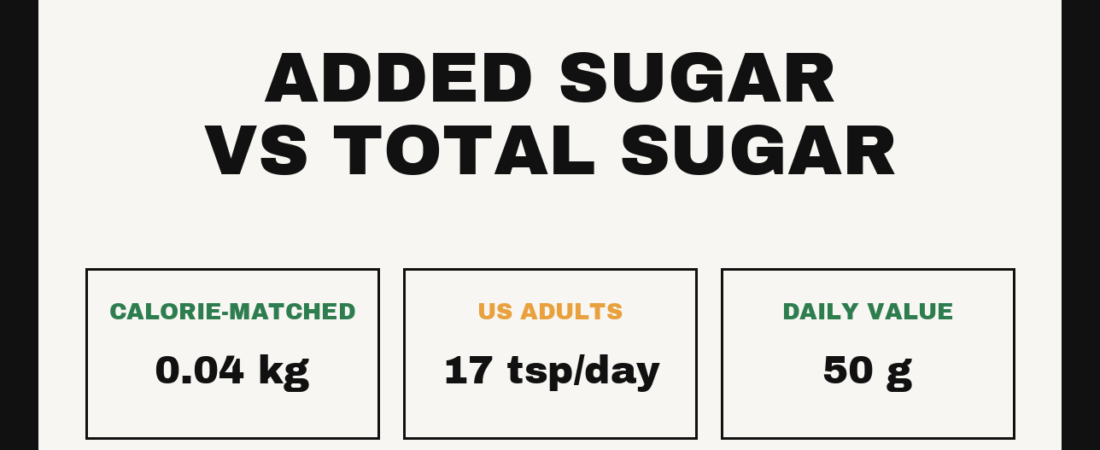
Short answer: total sugars count every sugar in the food, including the lactose in milk and the fructose in whole fruit. Added sugars count only what was put in during manufacturing, plus syrups and honey. The distinction is real and worth reading — but not because the molecules behave differently. In the BMJ meta-analysis of 30 trials, swapping sugar for other carbohydrates at matched calories changed body weight by 0.04 kg, which is nothing. When calories were left free to vary, cutting sugar lost 0.80 kg and adding it gained 0.75 kg.
Check your own intake against the limits with the sugar intake calculator, or see where sugar sits inside your wider carbohydrate total using the carbohydrate calculator.
The two lines on the label
US Nutrition Facts panels have carried an "Includes X g Added Sugars" line since the FDA’s 2016 final rule, with compliance required from January 2020 for larger manufacturers and January 2021 for smaller ones. The Daily Value is 50 g on a 2,000 calorie diet.
Total sugars sits above it, unindented, and has no Daily Value at all — deliberately, because the sugars in plain milk and fruit are not something regulators are asking you to limit. A pot of unsweetened yoghurt can read 12 g total sugars and 0 g added. If you track carbohydrate net of fibre, the net carbs calculator works from the same panel.
Where the definitions disagree
Two authorities, two slightly different lines in the sand. The WHO uses "free sugars", which covers everything added by manufacturer, cook or consumer plus the sugars naturally present in honey, syrups, fruit juices and fruit juice concentrates. It excludes sugars inside intact fruit and vegetables, and milk sugars.
The FDA’s "added sugars" is narrower. Juice concentrate counts only to the extent it exceeds what the same volume of 100% juice would contain, and several juice-concentrate uses are exempt outright. So a glass of orange juice is entirely free sugars to the WHO and zero added sugars to the FDA. That is the single biggest practical gap between the two systems, and it is why international advice on juice sounds stricter than the US label implies.
What the limits actually say
| Source | Limit | At 2,000 kcal | Status |
|---|---|---|---|
| WHO | Under 10% of energy, free sugars | 50 g | Strong recommendation |
| WHO | Under 5% of energy | 25 g | Conditional suggestion |
| Dietary Guidelines for Americans | Under 10% of calories, added sugars, ages 2+ | 50 g | Guideline |
| FDA label Daily Value | 50 g added sugars | 50 g | Labelling reference |
| American Heart Association | 100 kcal women, 150 kcal men | 25 g / 37.5 g | Scientific statement |
Three notes on that table, because these figures get garbled constantly. WHO’s widely quoted "25 g or six teaspoons" belongs to the 5% conditional level, not the 10% one. The AHA’s 2009 statement gives its limits in calories only — the 25 g and 37.5 g figures above are a straight 4 kcal/g conversion, not quotations. And the AHA’s consumer pages now phrase the same limits as about six and about nine teaspoons.
Does added sugar do anything calories don’t?
This is the question the label cannot answer, and the trial evidence is unusually clean on it. Te Morenga and colleagues screened nearly 8,000 trials and 9,000 cohort studies, and the split in their results is the whole story.
| Condition | Effect on body weight |
|---|---|
| Cut sugar, calories free to vary | −0.80 kg (95% CI 0.39 to 1.21) |
| Add sugar, calories free to vary | +0.75 kg (95% CI 0.30 to 1.19) |
| Swap sugar for other carbohydrate, calories matched | 0.04 kg (95% CI −0.04 to 0.13) |
Sugar moves your weight by moving how much you eat. Hold calories constant and the effect vanishes. The authors concluded exactly that: the change happens through altered energy intake.
Their own caveats are worth carrying. The ad libitum reduction effect lost statistical significance once high-risk-of-bias trials were excluded, heterogeneity was high, and few trials ran beyond ten weeks. Khan and Sievenpiper’s review reaches the stronger conclusion that sugars have no harmful effect independent of their calories — but that paper sits in an industry-sponsored supplement and its authors declare food-industry research and consulting ties, which is material when it is carrying this side of the argument.
Drinks are the real signal
If one category of added sugar has earned its reputation, it is beverages. Imamura and colleagues pooled 17 cohorts: each extra daily serving of sugar-sweetened drinks carried a relative risk for type 2 diabetes of 1.18, falling to 1.13 after adjusting for body fatness. The association survives the adjustment, which is the interesting part — though the authors note causality is not established and flag residual confounding.
For weight, Malik and colleagues found one daily serving associated with 0.22 kg of gain per year in adults. Modest, but relentless.
The cleanest comparison of sources comes from Choo and colleagues, who stratified 155 trial comparisons by food source. Substituted calorie-for-calorie, fruit actually lowered HbA1c by 0.19 percentage points. Harm appeared only where the sugar added excess energy — and there, sweetened drinks raised fasting glucose and accounted for over half the weighted harm to fasting insulin. Same molecule, opposite results, depending on whether it displaced calories or piled them on. Most of that evidence was rated low quality, and it comes from the same research group as the review noted above.
What Americans actually eat
USDA’s analysis of NHANES 2017–2018 puts added sugar intake in adults aged 20 and over at 17.1 teaspoon equivalents a day — 19.2 for men, 15.1 for women. At USDA’s 4.2 g per teaspoon equivalent that is roughly 72 g, against a 50 g Daily Value. The FDA separately states Americans get more than 13% of calories from added sugars, close to 270 calories a day.
Those two figures come from different sources and different years, so treat the gram conversion as arithmetic rather than a published number. Both land in the same place: average intake runs comfortably above every limit in the table.
Where the evidence is thin
Nearly all the long-term data on added sugar and disease is observational, and people who drink a lot of sweetened beverages differ from those who don’t in many ways researchers cannot fully adjust away. The trials that do control calories are mostly short. And the sugar guidelines themselves rest partly on dental caries and calorie displacement rather than on direct metabolic harm — a weaker and more honest justification than the public conversation suggests.
FAQ
What is the difference between sugar and added sugar?
Total sugars include naturally occurring ones — lactose in dairy, fructose and glucose in fruit. Added sugars are only those introduced in processing or cooking, plus syrups and honey. Subtract added from total and what remains came with the food.
How much added sugar per day is OK?
Under 10% of calories is the common ceiling, which is 50 g on a 2,000 calorie diet. The AHA is stricter at 100 calories for women and 150 for men, and WHO suggests under 5% as an additional target.
Does fruit count as added sugar?
Whole fruit, no — under both WHO and FDA definitions. Fruit juice is where they part company: the WHO counts it as free sugars, the FDA does not count 100% juice as added sugars.
Is honey an added sugar?
Yes, under both definitions, whenever it is used as a sweetener. Being unrefined does not change how it is classified or how it is metabolised.
Is added sugar worse than natural sugar for weight gain?
Not per gram, on the trial evidence. What makes added sugar practically worse is that it arrives in forms — particularly drinks — that add calories without displacing other food or producing much fullness.
Sources
- Te Morenga L, Mallard S, Mann J. Dietary sugars and body weight: systematic review and meta-analyses of randomised controlled trials and cohort studies. BMJ, 2013;346:e7492.
- World Health Organization. Guideline: sugars intake for adults and children. Geneva: World Health Organization, 2015.
- Johnson RK, Appel LJ, Brands M, Howard BV, Lefevre M, Lustig RH, Sacks F, Steffen LM, Wylie-Rosett J. Dietary sugars intake and cardiovascular health: a scientific statement from the American Heart Association. Circulation, 2009;120(11):1011–1020.
- US Department of Agriculture and US Department of Health and Human Services. Dietary Guidelines for Americans, 2020–2025. 9th edition, December 2020.
- US Food and Drug Administration. Food labeling: revision of the nutrition and supplement facts labels. Final rule, 81 FR 33742, 27 May 2016. Added sugars definition at 21 CFR 101.9(c)(6)(iii).
- Khan TA, Sievenpiper JL. Controversies about sugars: results from systematic reviews and meta-analyses on obesity, cardiometabolic disease and diabetes. European Journal of Nutrition, 2016;55(Suppl 2):25–43.
- Imamura F, O’Connor L, Ye Z, Mursu J, Hayashino Y, Bhupathiraju SN, Forouhi NG. Consumption of sugar sweetened beverages, artificially sweetened beverages, and fruit juice and incidence of type 2 diabetes: systematic review, meta-analysis, and estimation of population attributable fraction. BMJ, 2015;351:h3576.
- Malik VS, Pan A, Willett WC, Hu FB. Sugar-sweetened beverages and weight gain in children and adults: a systematic review and meta-analysis. American Journal of Clinical Nutrition, 2013;98(4):1084–1102.
- Choo VL, Viguiliouk E, Blanco Mejia S, et al. Food sources of fructose-containing sugars and glycaemic control: systematic review and meta-analysis of controlled intervention studies. BMJ, 2018;363:k4644.
- US Department of Agriculture, Agricultural Research Service. Food Patterns Equivalents Intakes from Food, What We Eat in America, NHANES 2017–2018, Table 1g.
General information, not medical advice.
Part of The Research — studies and position stands explained plainly.
GramGoal Team. We build nutrition calculators and price-check the supplement market monthly. General information, not medical advice. See our methodology and affiliate disclosure.