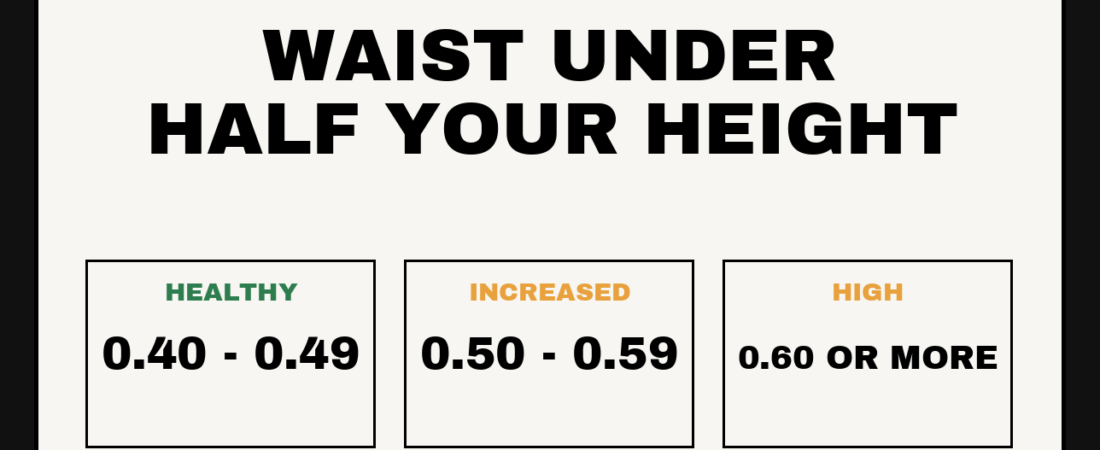
Short answer: keep your waist under half your height. That is a waist-to-height ratio below 0.5, and since January 2026 it is what NICE tells UK clinicians to use as the first check for central fat in anyone with a BMI under 35. The rule needs no chart, no age adjustment and no ethnicity adjustment. It is also a screening tool, not a diagnosis, and it adds less to formal risk prediction than its advocates usually admit.
Run your own numbers in the waist to height ratio calculator, then compare it against the BMI calculator and the waist to hip ratio calculator to see how differently the three can read the same body.
How to measure it
Measure at the midpoint between your lowest rib and the top of your hip bone, at the end of a normal breath out, tape snug but not compressing the skin. Not at the navel, not holding your stomach in. Then divide waist by height in the same units, so a 5 foot 10 adult with a 36 inch waist and a 178 cm adult with a 91 cm waist both land on 0.51.
The NICE categories
NICE guideline NG246, published in January 2026, sets three bands. They apply to adults of both sexes and all ethnicities, and the same bands are used for children and young people aged 5 and over.
| Waist-to-height ratio | NICE category | Reading |
|---|---|---|
| 0.40 to 0.49 | Healthy central adiposity | No increased health risk from central fat |
| 0.50 to 0.59 | Increased central adiposity | Increased health risk |
| 0.60 or more | High central adiposity | Further increased health risk |
The important exclusion: NICE does not recommend the ratio for adults with a BMI of 35 or above. At that point the measurement stops discriminating usefully, and the guidance says to treat the BMI as the signal instead.
Your number, by height
Half your height is the whole rule, so the ceiling is easy to memorise.
| Height | Waist ceiling (0.5) | Metric ceiling |
|---|---|---|
| 5 ft 0 in (152.4 cm) | 30.0 in | 76.2 cm |
| 5 ft 4 in (162.6 cm) | 32.0 in | 81.3 cm |
| 5 ft 8 in (172.7 cm) | 34.0 in | 86.4 cm |
| 6 ft 0 in (182.9 cm) | 36.0 in | 91.4 cm |
| 6 ft 4 in (193.0 cm) | 38.0 in | 96.5 cm |
What the research supports
Three findings do most of the work behind the 0.5 rule.
- 0.5 is a defensible global boundary. Browning, Hsieh and Ashwell reviewed the screening literature across populations and concluded that a single cut-off of 0.5 worked for predicting cardiovascular disease and diabetes without needing separate values by sex or ethnicity.
- It out-screens BMI and waist circumference. A meta-analysis of studies reporting area under the curve for cardiometabolic risk factors found waist-to-height ratio came out ahead of both waist circumference and BMI for diabetes, hypertension, dyslipidaemia and overall cardiovascular outcomes.
- It tracks mortality more steeply than BMI. Ashwell and colleagues modelled years of life lost in a British cohort of 7,414 adults followed to 2005.
| 30-year-old, modelled | Years of life lost | Compared with |
|---|---|---|
| Man, WHtR 0.7 | 7.2 | WHtR 0.5 |
| Woman, WHtR 0.7 | 4.6 | WHtR 0.5 |
| Man, BMI 40 | 10.5 | BMI 24 |
| Woman, BMI 40 | 5.3 | BMI 26 |
That table is often quoted badly. The BMI figures are larger in absolute terms; the authors’ claim is about the gradient across the range of real bodies, not about which row has the biggest number.
Why the military showed up
A large share of current search interest in this ratio is not clinical. It comes from US service members checking body composition standards. The appeal is the same one that produced the Navy circumference formula and the army body fat calculator: a tape and one division beats every other method on cost and speed.
Service policy changes and varies by branch, so read the current regulation rather than any website, including this one. What is stable is the arithmetic underneath.
Where the evidence is thin
- Adiposity measures add almost nothing to formal risk scores. The Emerging Risk Factors Collaboration pooled 58 studies and 221,934 people, with 14,297 cardiovascular events. Once blood pressure, diabetes history and lipids were in the model, adding BMI, waist circumference or waist-to-hip ratio moved the C-index by 0.0008 at best. A good ratio is not a substitute for knowing your blood pressure and lipids.
- Much of the supporting work shares an author. Margaret Ashwell is on the 2010 review, the 2012 meta-analysis and the 2014 mortality modelling, and has campaigned publicly for the measure. The findings hold up elsewhere, but a literature with one recurring advocate earns extra scepticism.
- Waist measurement is the weak link. Tape placement, breathing and how hard you pull change the reading by a centimetre or two, which is enough to move someone across a band boundary. Measure the same way every time or the trend is meaningless.
- The bands are round numbers. NICE has acknowledged that the cut-points were chosen to be memorable. Risk does not step up at 0.50 and again at 0.60. It rises continuously, and 0.49 is not meaningfully safer than 0.51.
- It is untested above BMI 35, and NICE explicitly excludes that group.
Used as intended it is a cheap first screen that catches the central fat BMI misses. Used as a weekly scoreboard it will mislead you, because waist and weight both swing with water and food volume. For a body composition read rather than a risk screen, use the body fat calculator.
FAQ
What is a good waist to height ratio?
Between 0.40 and 0.49. NICE calls that healthy central adiposity. From 0.50 to 0.59 is increased risk, and 0.60 or above is further increased risk.
What should my waist be for my height?
Less than half of it. At 5 ft 8 in that is under 34 inches; at 5 ft 4 in, under 32 inches; at 6 ft 0 in, under 36 inches.
Is waist to height ratio better than BMI?
For screening cardiometabolic risk, the pooled evidence says yes, mainly because it catches people at a normal BMI who carry fat centrally. For predicting cardiovascular events on top of blood pressure, lipids and diabetes status, neither measure adds much.
Does the same ratio apply to men and women?
Yes. That is the main argument for it over waist circumference, which needs different thresholds by sex and by ethnicity. NICE applies the same bands to both sexes and all ethnic groups.
Where exactly do I measure my waist?
Midway between your lowest rib and the top of your hip bone, breathing out normally. The navel is a common shortcut and a poor one, because its position shifts with body fat.
Does it work if I am very muscular?
Better than BMI does, since it measures the waist rather than total mass. NICE lists high muscle mass among the cases where the ratio can still be used, with the BMI 35 ceiling still applying.
Sources
- National Institute for Health and Care Excellence. Overweight and obesity management. NICE guideline NG246, January 2026. Recommendations 1.9.14 and 1.10.10.
- Browning LM, Hsieh SD, Ashwell M. A systematic review of waist-to-height ratio as a screening tool for the prediction of cardiovascular disease and diabetes: 0.5 could be a suitable global boundary value. Nutrition Research Reviews, 2010;23(2):247–269.
- Ashwell M, Gunn P, Gibson S. Waist-to-height ratio is a better screening tool than waist circumference and BMI for adult cardiometabolic risk factors: systematic review and meta-analysis. Obesity Reviews, 2012;13(3):275–286.
- Ashwell M, Mayhew L, Richardson J, Rickayzen B. Waist-to-height ratio is more predictive of years of life lost than body mass index. PLOS ONE, 2014;9(9):e103483.
- Ashwell M, Gibson S. Waist-to-height ratio as an indicator of early health risk: simpler and more predictive than using a matrix based on BMI and waist circumference. BMJ Open, 2016;6(3):e010159.
- Emerging Risk Factors Collaboration. Separate and combined associations of body-mass index and abdominal adiposity with cardiovascular disease: collaborative analysis of 58 prospective studies. The Lancet, 2011;377(9771):1085–1095.
General information, not medical advice.
GramGoal Team. We build nutrition calculators and price-check the supplement market monthly. General information, not medical advice. See our methodology and affiliate disclosure.