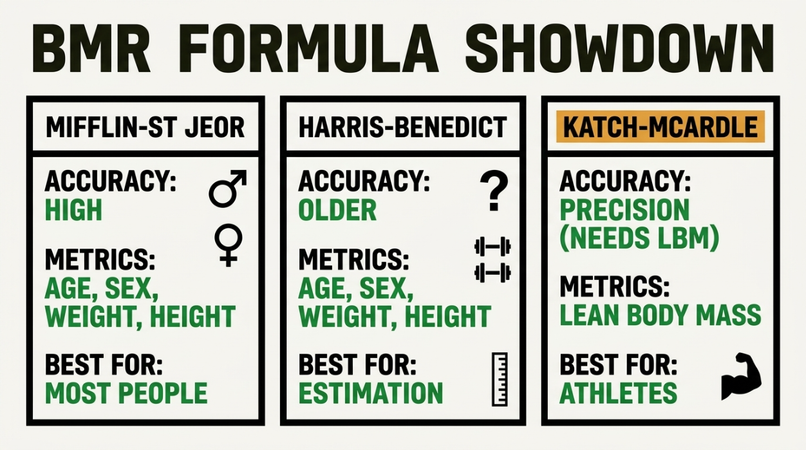
Short answer: Mifflin-St Jeor is the best default for most people, Harris-Benedict reads slightly higher and remains perfectly usable, and Katch-McArdle beats both if you have a reliable body fat measurement. All three carry roughly a ten percent error band, and the activity multiplier you choose afterwards affects your final number far more than which equation you started with.
Try them side by side: Mifflin-St Jeor, Harris-Benedict, Katch-McArdle.
The three equations
Harris-Benedict, 1919 and revised 1984
The oldest. The original was derived from a small early-twentieth-century population, and the version in use today is the Roza and Shizgal revision from 1984. It reads consistently higher than Mifflin-St Jeor, typically by 50 to 100 kcal, with the gap widening in larger and older people.
Mifflin-St Jeor, 1990
Derived from a larger, more contemporary sample. Comparison studies, including the widely cited Frankenfield review, generally found it predicted resting metabolic rate more accurately than the alternatives in non-obese and obese adults, which is why most dietetics guidance adopted it as the default.
Katch-McArdle
The structural outlier. It ignores total bodyweight and works from lean body mass, on the reasoning that lean tissue drives resting energy expenditure while stored fat is comparatively inert. Mechanistically the most sensible approach, and entirely dependent on the quality of your body fat measurement.
How much they actually differ
| Person | Mifflin-St Jeor | Harris-Benedict | Spread |
|---|---|---|---|
| Man, 80 kg, 175 cm, 30 | 1,749 kcal | 1,822 kcal | 73 |
| Woman, 65 kg, 165 cm, 30 | 1,370 kcal | 1,406 kcal | 36 |
| Man, 95 kg, 180 cm, 50 | 1,830 kcal | 1,928 kcal | 98 |
| Woman, 55 kg, 160 cm, 25 | 1,264 kcal | 1,325 kcal | 61 |
Under 100 kcal in every case, and inside the error band of both. That is the first thing worth internalising: the choice between these two equations is not what decides whether your diet works.
Where Katch-McArdle separates from the pack
Weight-based equations give three people of identical weight, height, age and sex the same answer. Katch-McArdle does not.
| Profile at 80 kg | Body fat | Lean mass | Katch-McArdle | Mifflin-St Jeor |
|---|---|---|---|---|
| Lean athlete | 10% | 72 kg | 1,925 kcal | 1,749 kcal |
| Average | 20% | 64 kg | 1,752 kcal | 1,749 kcal |
| Higher body fat | 32% | 54.4 kg | 1,546 kcal | 1,749 kcal |
Nearly 400 kcal separates the lean athlete from the higher body fat profile, while Mifflin-St Jeor treats them identically. If you sit at either extreme and know your body fat percentage, Katch-McArdle is the better tool. If you are near average, the equations converge and it hardly matters.
The variable that actually decides your number
Here is the part most comparisons bury. Take a BMR of 1,749 kcal:
| Activity level | Multiplier | Daily calories |
|---|---|---|
| Sedentary | 1.2 | 2,099 |
| Light | 1.375 | 2,405 |
| Moderate | 1.55 | 2,711 |
| Active | 1.725 | 3,017 |
One step up the activity table moves your target by roughly 300 kcal, three to four times the difference between BMR equations. And most people overestimate here: three gym sessions a week alongside a desk job is light to moderate, not active. If your weight is not behaving as predicted, an inflated activity multiplier is the most likely cause, not the equation.
Which to use
- You do not know your body fat percentage: Mifflin-St Jeor.
- You know it and it is reliable: Katch-McArdle, particularly if you are lean or carrying high body fat.
- You have been using Harris-Benedict and adjusting from results: keep using it. Consistency beats switching.
- You are comparing numbers between websites: check which equation and multiplier each uses before concluding one is wrong.
How to make any of them accurate
Every equation is a starting estimate. The measurement that matters is your own weight trend.
- Eat at the calculated maintenance figure for 14 to 21 days without changing training.
- Weigh daily under identical conditions, and use the weekly average.
- Stable average weight means the estimate is your real maintenance.
- Gaining about 0.25 kg per week means your true figure is roughly 275 kcal lower.
- Losing at that rate means it is about 275 kcal higher. Adjust and repeat.
Three weeks of your own data beats any equation, because it measures you rather than a population average.
FAQ
Which BMR formula is most accurate?
Mifflin-St Jeor for the general population, Katch-McArdle for lean or trained people with a reliable body fat measurement.
Why do calculators give me different numbers?
Usually the activity multiplier rather than the equation. Multiplier choice moves the result several times more than formula choice.
Is Harris-Benedict wrong?
No. It reads slightly higher and remains widely used. The difference sits inside the error band of both equations.
How accurate are BMR equations?
Roughly ten percent either way for most people. Individual metabolism varies more than four input variables can capture.
Sources
- Mifflin MD, St Jeor ST et al. A new predictive equation for resting energy expenditure in healthy individuals. American Journal of Clinical Nutrition, 1990.
- Roza AM, Shizgal HM. The Harris Benedict equation reevaluated. American Journal of Clinical Nutrition, 1984.
- Frankenfield D, Roth-Yousey L, Compher C. Comparison of predictive equations for resting metabolic rate in healthy nonobese and obese adults: a systematic review. Journal of the American Dietetic Association, 2005.
- Katch VL, McArdle WD, Katch FI. Essentials of Exercise Physiology.
- Cunningham JJ. A reanalysis of the factors influencing basal metabolic rate in normal adults. American Journal of Clinical Nutrition, 1980.
General information, not medical advice.
GramGoal Team. We build nutrition calculators and price-check the supplement market monthly. General information, not medical advice. See our methodology and affiliate disclosure.