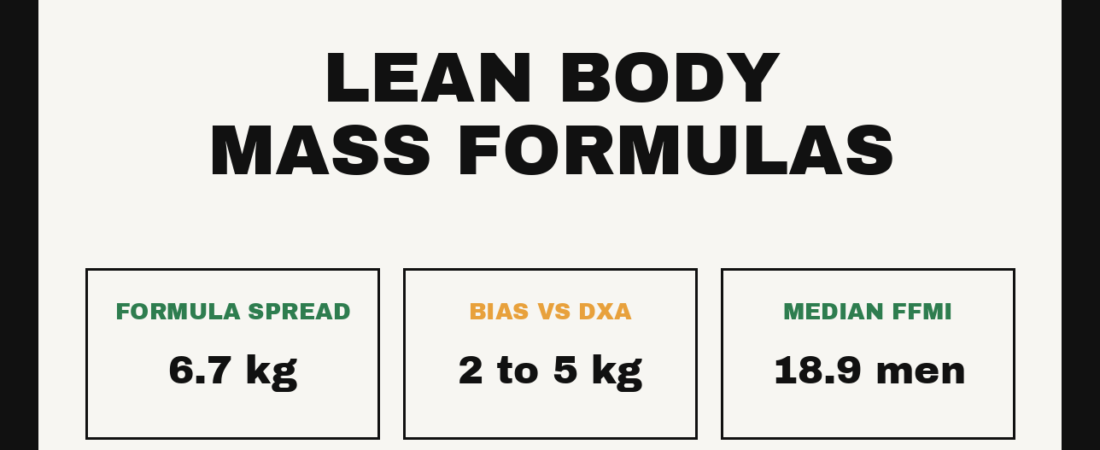
Short answer: lean body mass is everything you are made of except fat — muscle, bone, organs, skin and the water in all of it. In normal-weight adults it runs roughly 78–87% of body weight in men and 67–75% in women. The height-and-weight formulas behind most online calculators sit about 2–5 kg off a DXA scan on average, with 95% agreement windows 12–14 kg wide. They are built for scaling drug doses and comparing groups, not for tracking your own body composition.
Run the numbers with the lean body mass calculator, or convert a known body fat percentage with the body fat calculator.
Lean mass is not muscle
This is the most common mix-up, and the gap is large. Janssen and colleagues measured whole-body skeletal muscle by MRI in 468 adults: about 33.0 kg in men and 21.0 kg in women, which works out to roughly 38.4% and 30.6% of body mass respectively.
So skeletal muscle is under 40% of a man’s body weight while lean mass is around 80%. The other half of your lean mass is skeleton, organs, connective tissue and water. When a scale tells you your "muscle mass" went up two kilograms in a fortnight, it is almost certainly reporting water.
The formulas, and how much they disagree
Three equations dominate. Boer’s came from fluid-volume work in 66 healthy adults; Hume’s from total body water in 56; the one sold everywhere as "the James formula" has a messier pedigree, discussed below. Here is what each returns for the same man — 80 kg, 178 cm.
| Formula | Estimated LBM | Implied body fat |
|---|---|---|
| Hume | 57.1 kg | 28.6% |
| Boer | 60.9 kg | 23.9% |
| "James" (128 constant) | 62.1 kg | 22.3% |
| "James" (120 constant) | 63.8 kg | 20.3% |
Same man, same two measurements, 6.7 kg of spread — an 8.3 percentage-point swing in body fat depending purely on which formula the website happened to code. That spread is the single most useful fact on this page.
The "James" attribution is worth untangling. The 1976 DHSS/MRC report compiled by W.P.T. James is a real document, but what it contains is a body-fat-percentage equation. The LBM formula carrying his name traces to Hallynck and colleagues in 1981 and to Morgan and Bray in 1994 — and those two versions use different male constants, 128 and 120. The DICOM imaging standard documents the discrepancy explicitly and carries both. Nobody has settled which is correct.
How far off are they?
Puri and Blake tested ten equations against whole-body DXA in 1,558 adults aged 60–65. Bias is the average miss; the limits of agreement are the width of the window containing 95% of individual errors.
| Formula | Bias, men | LOA, men | Bias, women | LOA, women |
|---|---|---|---|---|
| Boer | −2.6 kg | 13.0 kg | −4.5 kg | 12.1 kg |
| Hume | +1.8 kg | 14.2 kg | −3.8 kg | 11.3 kg |
| "James" / Hallynck | −3.2 kg | 13.6 kg | −4.9 kg | 14.0 kg |
| Gallagher (best, men) | −2.4 kg | 12.8 kg | −2.3 kg | 10.7 kg |
| Janmahasatian (best, women) | −2.3 kg | 13.3 kg | −0.9 kg | 10.7 kg |
Even the winners have agreement windows about 11 kg wide, meaning an individual estimate can plausibly be five or six kilograms out in either direction. The popular three run 2–5 kg systematically off on top of that. Hume is the odd one out in men — biased positive, and with the worst proportional error, so it drifts further the further you are from average.
Two honest limits on that table: the sample was a narrow age band of mostly white adults, and the authors note most of these equations were derived in white populations and may not transfer.
FFMI and the famous 25 ceiling
Fat-free mass index is lean mass divided by height squared — BMI’s lean-only cousin. Schutz and colleagues measured 5,635 Swiss adults and found a median FFMI of 18.9 kg/m² in men aged 18–34 and 15.4 in women. Our 80 kg example lands near 19.2 by Boer, so right at the median.
Then there is the claim that FFMI above 25 proves steroid use. That comes from Kouri and colleagues in 1995, and it is routinely overstated. In their 74 self-reported non-users, height-normalised FFMI topped out at 25.0 and none exceeded it. But many steroid users also sat below 25, so the number never separated the groups — and the paper’s own comparison set of 20 Mr. America winners from 1939–1959 averaged 25.4. The authors called their findings preliminary and offered 25 as a possible screening trigger, explicitly not a diagnosis. Body fat was measured by skinfold calipers, not DXA.
Check your own against the FFMI calculator, and note that it inherits whatever error your lean mass estimate carried in.
What actually measures lean mass
Four-compartment models are the research criterion, because they measure the hydration and density of lean tissue instead of assuming it. Hydrostatic weighing was the historical gold standard and is now largely retired. DXA is the practical clinical reference, with one notable blind spot: it assumes lean tissue is consistently hydrated, so extra body water reads as lean tissue. Air displacement plethysmography is close behind but overestimates fat in lean people.
Bioelectrical impedance and skinfolds are field methods. Their error depends on the equation inside the device and on your hydration, and it widens as body fat rises. Consumer scales rarely disclose which equation they use. If you have a known body fat percentage from a decent measurement, the Katch-McArdle calculator uses lean mass directly and will beat any height-weight formula.
Where the evidence is thin
Boer and Hume were derived in fewer than 70 people each, in the 1960s and 1980s, using indirect tracer methods. The Puri and Blake validation covers one narrow age band. Boer’s and Hume’s exact coefficients are reproduced here as published in that 2022 comparison, since the original papers are paywalled and the full-precision constants circulating on calculator sites appear in no peer-reviewed source. No study has validated these three against a four-compartment model.
FAQ
How do you calculate lean body mass?
Properly, you measure body fat percentage and subtract: lean mass equals weight times one minus body fat. Failing that, a height-weight formula gives a rough estimate. Boer for men is 0.407 times weight in kg plus 0.267 times height in cm minus 19.2.
What is a good lean body mass?
There is no single target, because lean mass scales with height. FFMI is the fairer comparison: median is about 18.9 kg/m² for younger men and 15.4 for women. Low FFMI matters clinically; a high one is not a health goal in itself.
What is the difference between lean body mass and fat-free mass?
Strictly, fat-free mass excludes all lipid while lean body mass includes the small amount of essential fat inside cell membranes and organs — a difference of two or three percent. In practice the literature uses them interchangeably, and so do calculators.
Is average male lean body mass around 60 kg?
For an average-sized man, the formulas cluster between about 57 and 64 kg, which is why that figure gets quoted. The honest version is that the estimate has a several-kilogram error bar attached.
Can I track muscle gain with a lean mass calculator?
No. Height-weight formulas take only your height and weight, so any change they report is just a reflection of weight change. They cannot detect muscle gain at all.
Sources
- Puri T, Blake GM. Comparison of ten predictive equations for estimating lean body mass with dual-energy X-ray absorptiometry in older patients. British Journal of Radiology, 2022;95(1133):20210378.
- Boer P. Estimated lean body mass as an index for normalization of body fluid volumes in humans. American Journal of Physiology, 1984;247(4 Pt 2):F632–F636.
- Hume R. Prediction of lean body mass from height and weight. Journal of Clinical Pathology, 1966;19(4):389–391.
- Hallynck TH, Soep HH, Thomis JA, Boelaert J, Daneels R, et al. Should clearance be normalised to body surface or to lean body mass? British Journal of Clinical Pharmacology, 1981;11(5):523–526.
- Morgan DJ, Bray KM. Lean body mass as a predictor of drug dosage. Implications for drug therapy. Clinical Pharmacokinetics, 1994;26(4):292–307.
- Janssen I, Heymsfield SB, Wang Z, Ross R. Skeletal muscle mass and distribution in 468 men and women aged 18–88 yr. Journal of Applied Physiology, 2000;89(1):81–88.
- Schutz Y, Kyle UUG, Pichard C. Fat-free mass index and fat mass index percentiles in Caucasians aged 18–98 y. International Journal of Obesity, 2002;26(7):953–960.
- Kyle UG, Schutz Y, Dupertuis YM, Pichard C. Body composition interpretation: contributions of the fat-free mass index and the body fat mass index. Nutrition, 2003;19(7–8):597–604.
- Kouri EM, Pope HG Jr, Katz DL, Oliva P. Fat-free mass index in users and nonusers of anabolic-androgenic steroids. Clinical Journal of Sport Medicine, 1995;5(4):223–228.
- Holmes CJ, Racette SB. The utility of body composition assessment in nutrition and clinical practice: an overview of current methodology. Nutrients, 2021;13(8):2493.
- Carnevale V, Piscitelli PA, Minonne R, Castriotta V, Cipriani C, Guglielmi G, Scillitani A, Romagnoli E. Estimate of body composition by Hume’s equation: validation with DXA. Endocrine, 2015;49(1):65–69.
General information, not medical advice.
Part of The Research — studies and position stands explained plainly.
GramGoal Team. We build nutrition calculators and price-check the supplement market monthly. General information, not medical advice. See our methodology and affiliate disclosure.